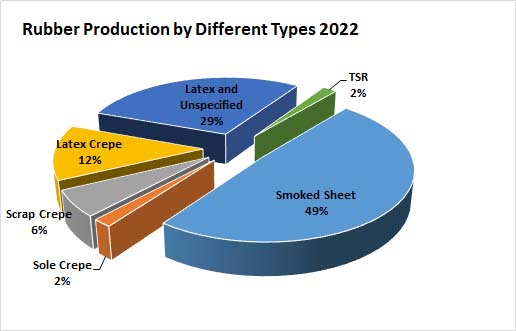
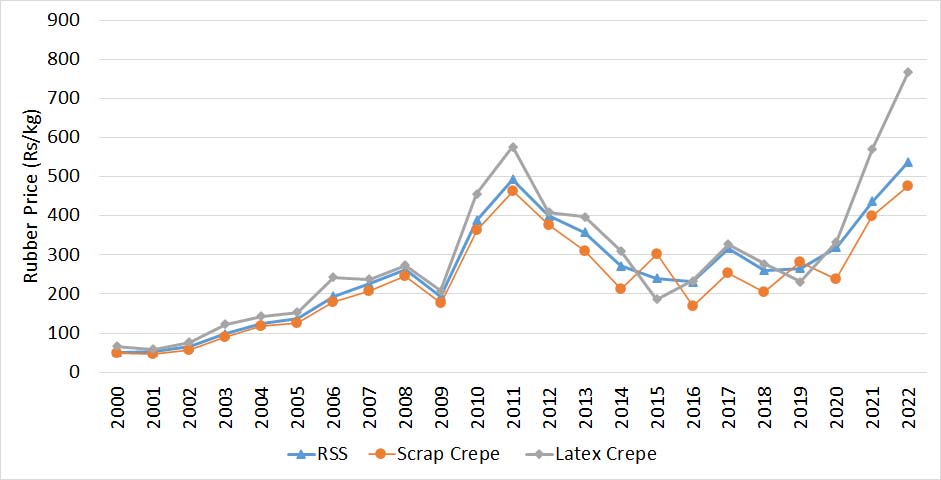
|
Year
|
Sheet
|
Sole
Crepe
|
Scrap
Crepe
|
Latex
Crepe
|
T.S.R.
|
Latex
Other
|
Total (MT)
|
| |
|
|
|
|
|
|
|
|
1980
|
72,404
|
4,278
|
13,422
|
31,830
|
9,745
|
1,472
|
133,151
|
|
1981
|
62,067
|
4,200
|
9,033
|
33,935
|
13,198
|
1,512
|
123,945
|
|
1982
|
62,230
|
4,148
|
8,328
|
35,997
|
12,372
|
2,155
|
125,230
|
|
1983
|
56,596
|
4,326
|
4,602
|
64,051
|
8,102
|
2,320
|
139,997
|
|
1984
|
66,926
|
4,275
|
7,480
|
52,519
|
8,107
|
3,614
|
142,921
|
|
1985
|
65,883
|
4,164
|
6,135
|
41,260
|
13,686
|
6,365
|
137,493
|
|
1986
|
62,883
|
4,446
|
7,400
|
43,480
|
14,265
|
5,787
|
138,261
|
|
1987
|
55,580
|
4,679
|
9,069
|
35,080
|
11,667
|
5,732
|
121,807
|
|
1988
|
62,865
|
2,894
|
4,954
|
33,664
|
14,151
|
3,864
|
122,392
|
|
1989
|
54,307
|
2,589
|
3,666
|
31,316
|
13,985
|
4,882
|
110,745
|
|
1990
|
56,356
|
4,147
|
5,803
|
32,044
|
9,893
|
4,860
|
113,103
|
|
1991
|
51,339
|
2,449
|
7,376
|
28,735
|
6,750
|
7,204
|
103,853
|
|
1992
|
45,626
|
3,684
|
5,017
|
24,554
|
15,497
|
11,770
|
106,148
|
|
1993
|
43,751
|
3,864
|
4,319
|
25,181
|
13,981
|
13,104
|
104,200
|
|
1994
|
40,859
|
3,955
|
4,429
|
30,078
|
11,521
|
14,459
|
105,301
|
|
1995
|
42,190
|
2,748
|
2,920
|
29,278
|
22,970
|
5,611
|
105,717
|
|
1996
|
53,221
|
3,739
|
4,102
|
33,698
|
11,067
|
6,674
|
112,501
|
|
1997
|
46,067
|
3,994
|
2,796
|
34,121
|
9,232
|
9,572
|
105,782
|
|
1998
|
26,919
|
4,865
|
1,858
|
51,527
|
5,814
|
4,727
|
95,710
|
|
1999
|
28,677
|
4,250
|
1,644
|
39,391
|
4,758
|
17,864
|
96,584
|
|
2000
|
34,003
|
4,512
|
1,788
|
28,110
|
3,879
|
15,344
|
87,636
|
|
2001
|
30,344
|
3,915
|
2,743
|
26,112
|
3,657
|
19,461
|
86,232
|
|
2002
|
42,770
|
2,987
|
2,185
|
20,831
|
1,231
|
20,514
|
90,518
|
|
2003
|
50,015
|
2,195
|
3,117
|
17,131
|
1,193
|
18,359
|
92,010
|
|
2004
|
46,705
|
2,035
|
3,708
|
12,481
|
2,812
|
27,000
|
94,741
|
|
2005
|
50,170
|
2,739
|
2,883
|
12,914
|
5,880
|
29,766
|
104,352
|
|
2006
|
46,260
|
3,949
|
1,606
|
20,224
|
9,038
|
28,076
|
109,153
|
|
2007
|
48,875
|
4,077
|
1,693
|
21,756
|
9,564
|
31,586
|
117,551
|
|
2008
|
55,011
|
3,937
|
2,711
|
21,043
|
10,968
|
35,573
|
129,243
|
|
2009
|
54,550
|
5,448
|
3,502
|
31,670
|
11,775
|
29,934
|
136,879
|
|
2010
|
59,248
|
6,711
|
1,842
|
52,504
|
8,341
|
24,341
|
152,987
|
|
2011
|
60,699
|
3,384
|
1,332
|
59,933
|
7,981
|
24,869
|
158,198
|
|
2012
|
59,242
|
1,902
|
1,280
|
36,550
|
8,672
|
44,403
|
152,050
|
|
2013
|
62,800
|
2,379
|
2,440
|
15,373
|
9,566
|
37,863
|
130,421
|
|
2014
|
48,539
|
2,410
|
1,022
|
11,832
|
7,615
|
27,155
|
98,573
|
|
2015
|
44,392
|
1,939
|
886
|
8,266
|
7,606
|
25,478
|
88,567
|
|
2016
|
39,754
|
1,575
|
791
|
12,618
|
3,865
|
20,497
|
79,100
|
|
2017
|
41,523
|
1,476
|
830
|
9,160
|
1,204
|
28,878
|
83,071
|
|
2018
|
41,300
|
1,400
|
2,600
|
10,500
|
800
|
26,000
|
82,600
|
| 2019 |
37,376 |
2,104 |
4,485 |
7,849 |
1,205 |
21,733 |
74,752 |
| 2020 |
39,102 |
1,047 |
4,692 |
7,223 |
1,529 |
24,612 |
78,205 |
| 2021 |
38,442 |
1,150 |
4,613 |
8,154 |
853 |
23,670 |
76,884 |
| 2022 |
34,749 |
1,266 |
4,252 |
8,948 |
1,291 |
20,353 |
70,867 |
|


 Call 1919